2. Colouring and Toggling
Colour by gene expression
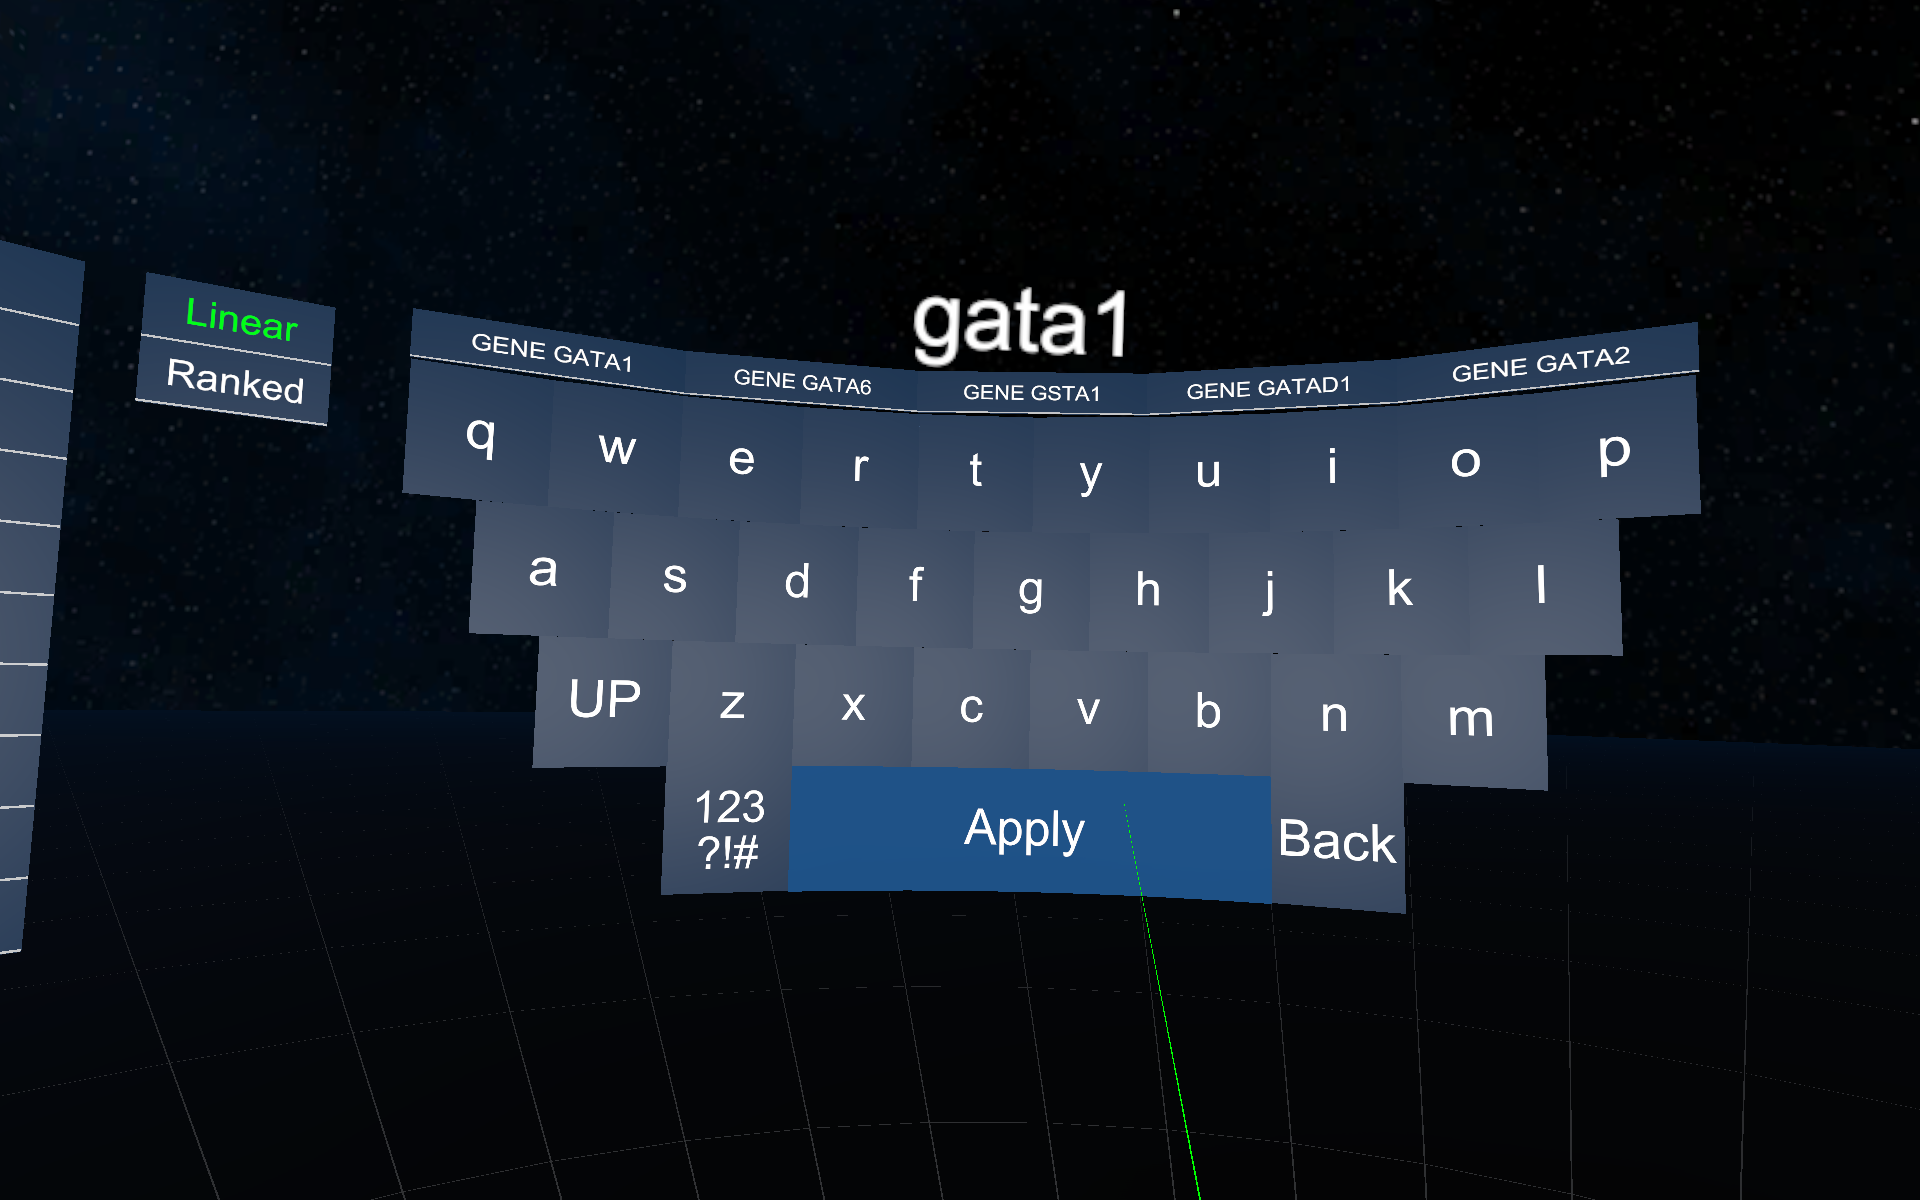
To view the expression of a specific gene in your graphs; activate the menu and press the "Keyboard" button. A large keyboard will appear and your action controller will now feature a laser pointer when pointed towards the keyboard. Point the laser at the keyboard and then pull the trigger to type a letter. The "Back" button will remove the last typed letter, the "Clear" button will remove all typed letters and the "123 !#%" button can be used to type numbers and special characters. Once you have typed your gene name press "Enter" and your graphs will be colored according to the expression of that gene if it was present in the supplied dataset. If the gene was not found in the dataset, the graphs will not be recolored.
After you color graphs based on a gene, you can view information about the currently colored gene in the legend.
There are currently two modes that can be chosen when coloring, "Linear" and "Ranked". You can choose between these modes using the buttons to the left of the keyboard. The mode with the green text is the chosen one and the default mode is linear. In linear mode the expressions are divided into equally large ranges and colors are chosen accordingly. In ranked, the expressions are sorted and an equal amount of cells are colored with each color.
The autocomplete feature will suggest genes that are displayed just above the keyboard. There may also be facs measurements or attributes that are suggested. Pointing the laser pointer at one of the suggestions and pressing the trigger button will color all graphs by the suggestion.
The default colors used for coloring the graphs based on some expression are blue to red via yellow, meaning cells that have the lowest expression are colored blue, the highest expression are colored red, the middle point is yellow and zero expression is dark grey. These colors can be changed in the settings menu, see this section for more information.
After you have colored graphs by a gene expression, the gene is saved in a list to the left of the keyboard. Point the laser at any gene in this list and pull the trigger to color graphs according to this gene's expression again. Only genes that were found in the dataset are put into the list. If you want to compare one gene expression to many other, you can lock that gene expression using the padlocks on the left side of the list to ensure it won't be removed from the list when it's full.
Pressing the left-arrow-chevron to the left of the gene name will calculate the ten most correlated and ten most anti-correlated genes compared to that gene. These genes will appear in a new list to the left. As always, point the laser at a gene name and pull the trigger to color graphs by these genes.