Video run-throughs
Click on a thumbnail to load the video.
If you are not familiar with
the HTC Vive; this video shows you how to
use the different buttons on the HTC Vive
controller.
An extended run-through showing you
how to use the key features of
CellexalVR.
Quick guide on how to set up a
multi-user session. Create a passcode
protected room for others to join.
Short run-through session showing the multi-user mode. Link to network port information.
A showcase of the new key features in the 0.14.0 update for CellexalVR.
Key features
Click on a thumbnail to load the video.
Each box has a dataset in it. Load
a dataset by throwing the cells from
a box into the loading machine.
Read more
Type a gene name with the keyboard
to color graphs by the expression of
that gene. The recent searches are saved and can
easily be reused.
Read
more
Create a free hand selection to
create custom groups with the selection
tool using your hand. The user uses his/her thumb to
change color with the controller's
round touchpad. Changing color defines a new group.
Read more
Calculate differentially expressed
genes and generate a heatmap from
the selection you made. The heatmaps can be moved
and resized freely. Multiple heatmaps
can be made in the same session for simultaneous
viewing.
Read more
Generate transcription factor
networks from the selection you made.
Multiple networks can be made in the same session
for simultaneous viewing. Networks can be enlarged
for more detailed viewing. Arcs to show common gene
pairs between networks can be spawned.
Read more
If index sorting has been used the
graph can be colored by the
expression of a selection cell surface marker using
the menu. Subgraphs can be constructed that uses the
FACS measurements as dimensions.
Read
more
If attributes have been defined the
graph can be colored by one or more
attributes such as cell type. Subgraphs with only
the selected attributes can be constructed.
Read
more
Additional features
Click on a thumbnail to load the video.
The hide tool allows the user to
temporarily hide graphs or networks.
Things that are hidden are placed on top of the menu
and can be brought back
anytime.
Read more
The delete tool is used to remove
objects from the scene that are no
longer needed. As a sort of safety measure, the
graphs can not be deleted.
Read more
The draw tool can be used to draw
lines to show others what you are
looking at, or to make notes.
Read more
The laser tool can move graphs,
heatmaps or networks just by pointing
the laser at them and then grabbing them. It can
also be used to make things fly away
and become larger, effectivily putting them in the
background. Graphs, heatmaps and
networks that are put in the background this way can
be brought back anytime.
Read more
Images
Click on an image to open it in a new tab
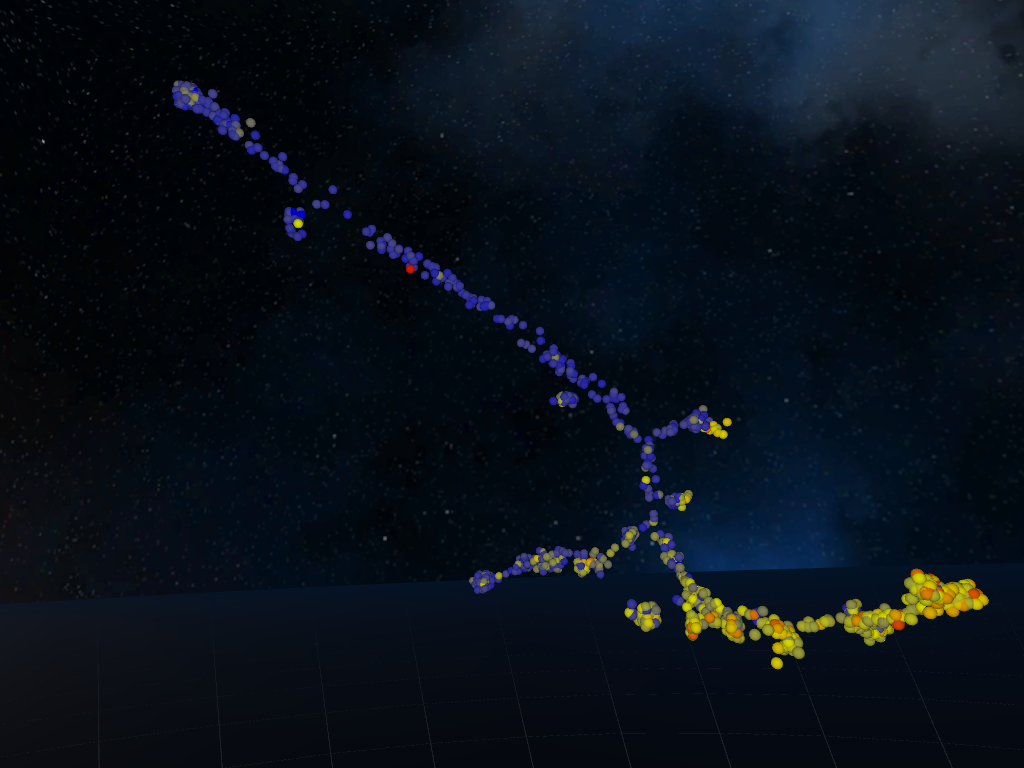
A graph colored by a facs measurement
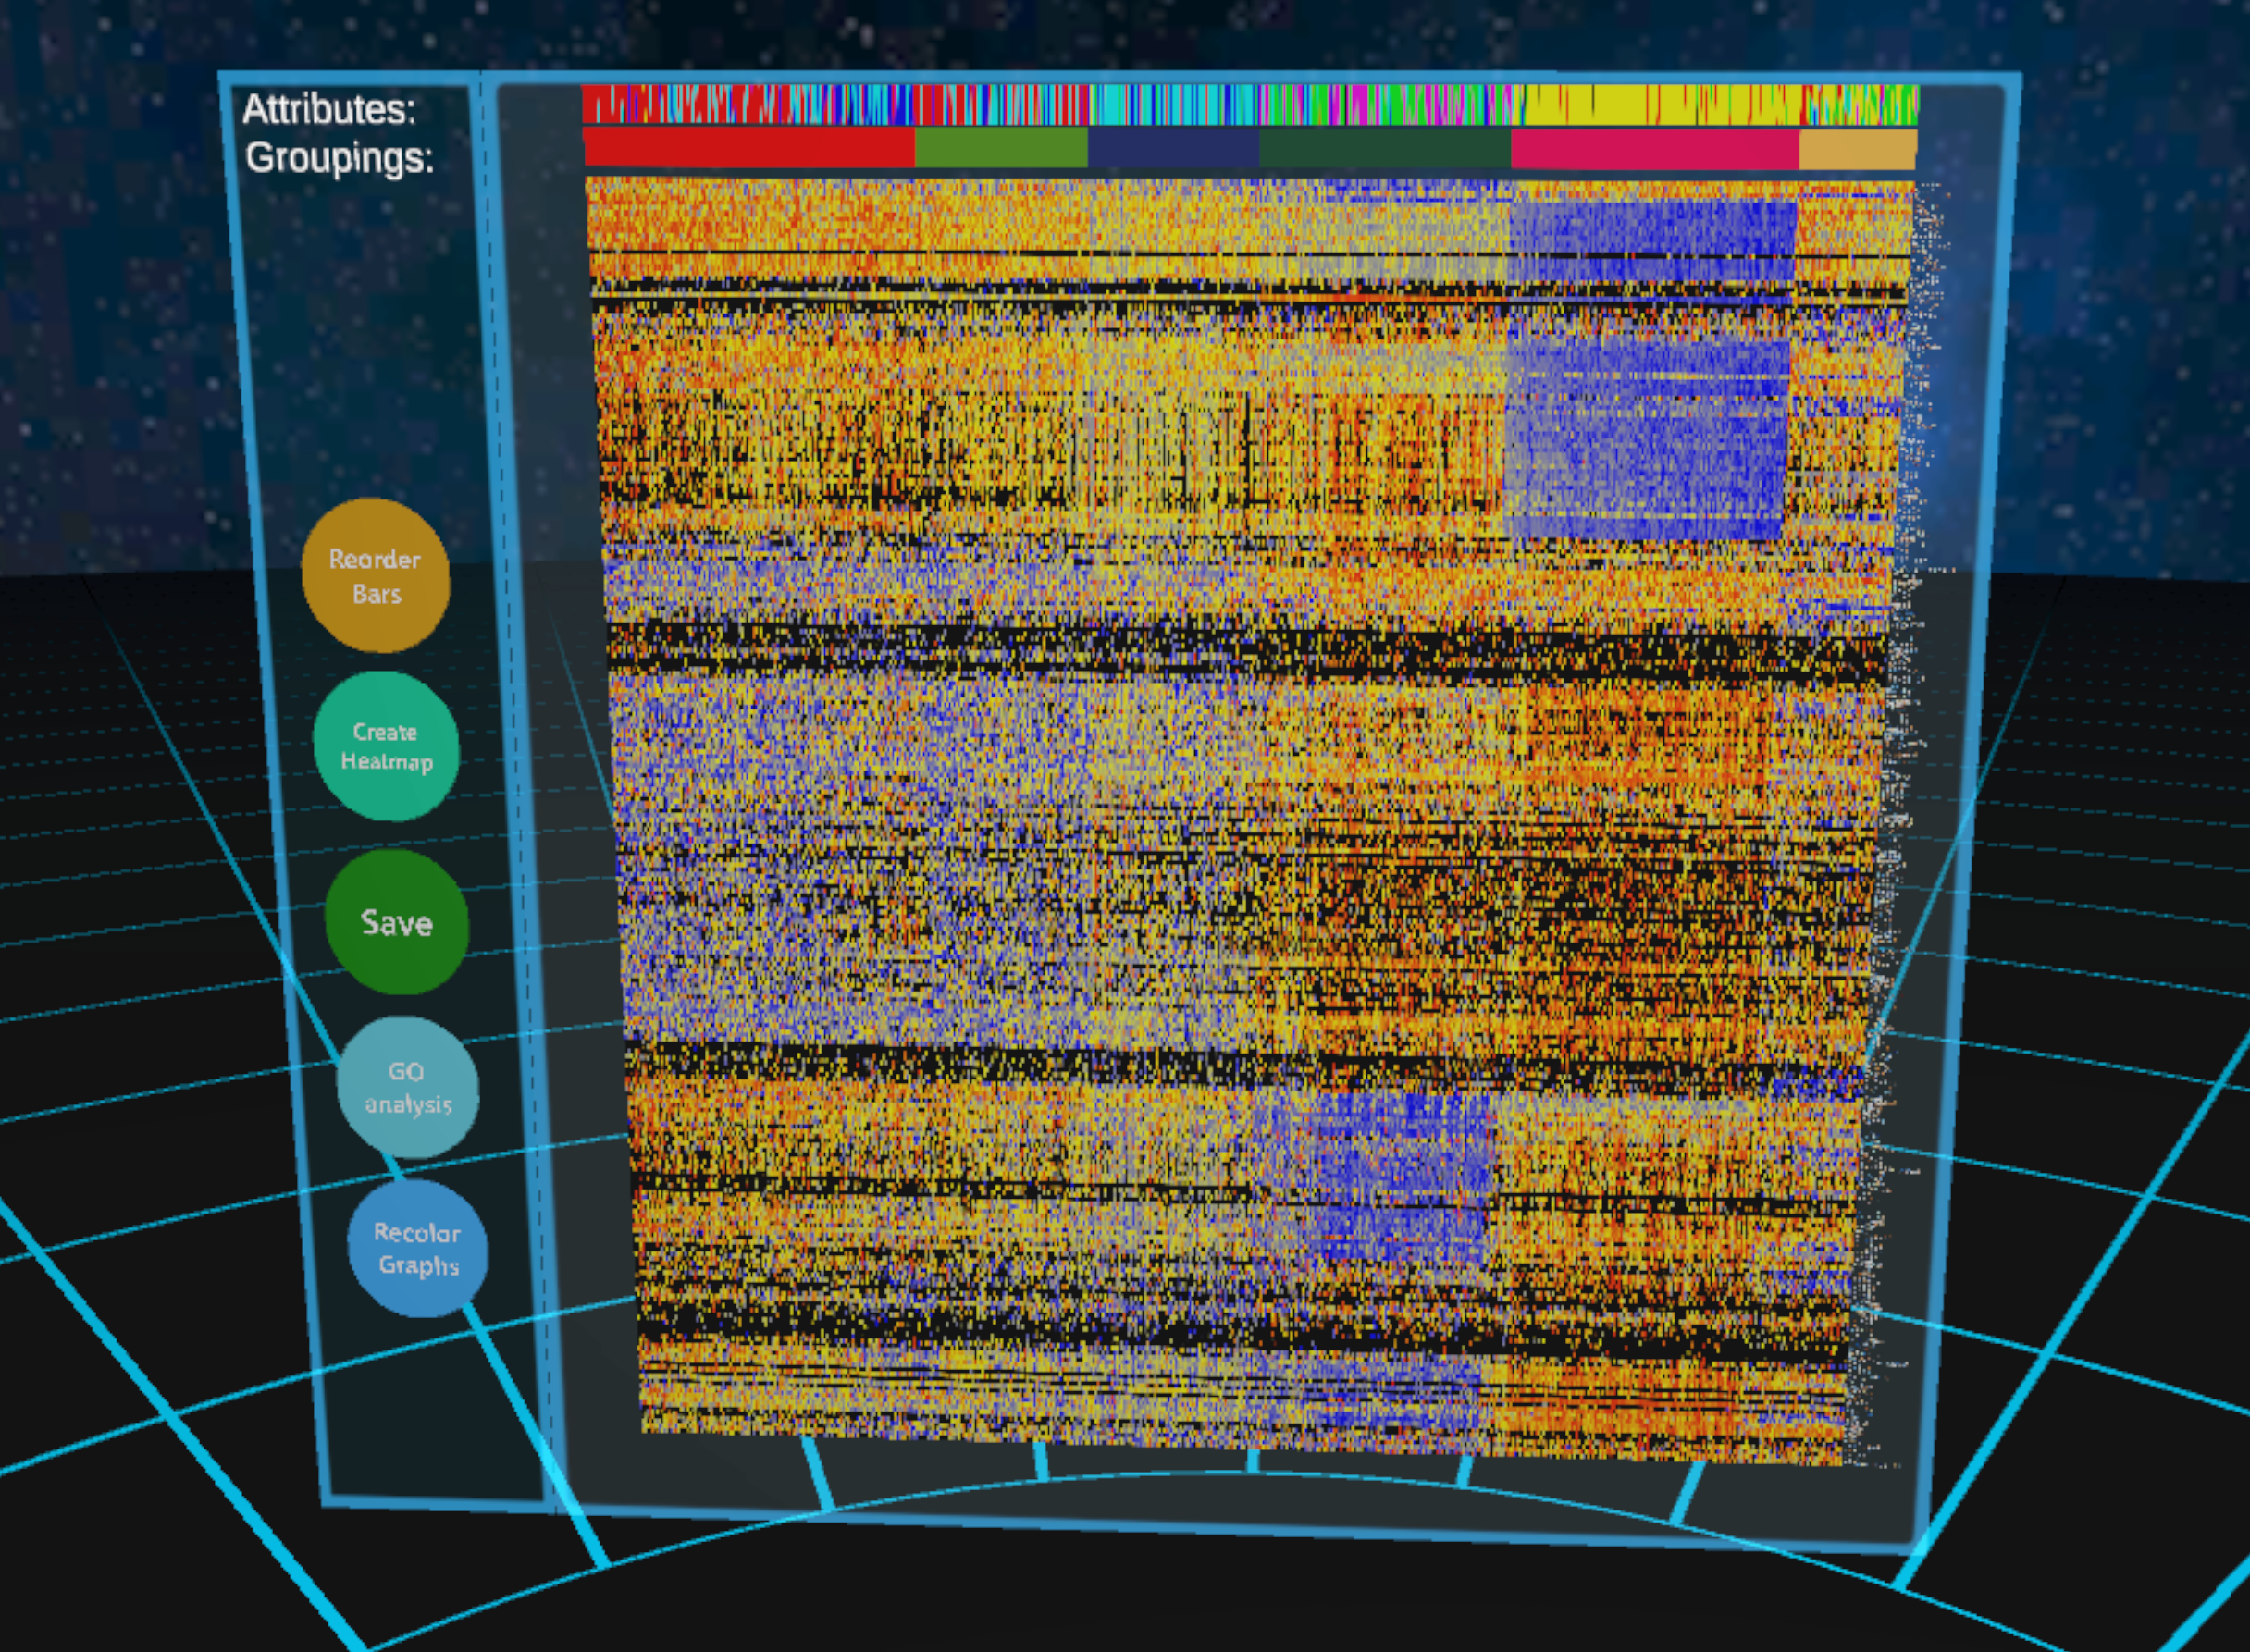
A generated heatmap

A group of generated networks
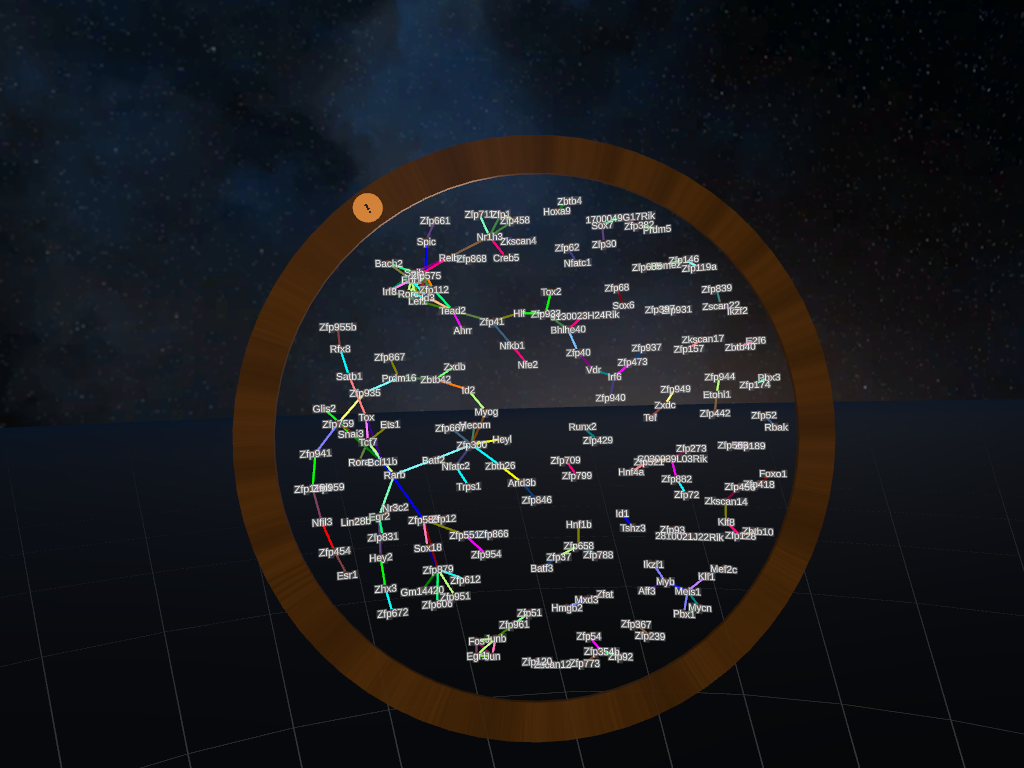
Networks can be enlarged for a better view