5. Correlation Networks
Creating a network
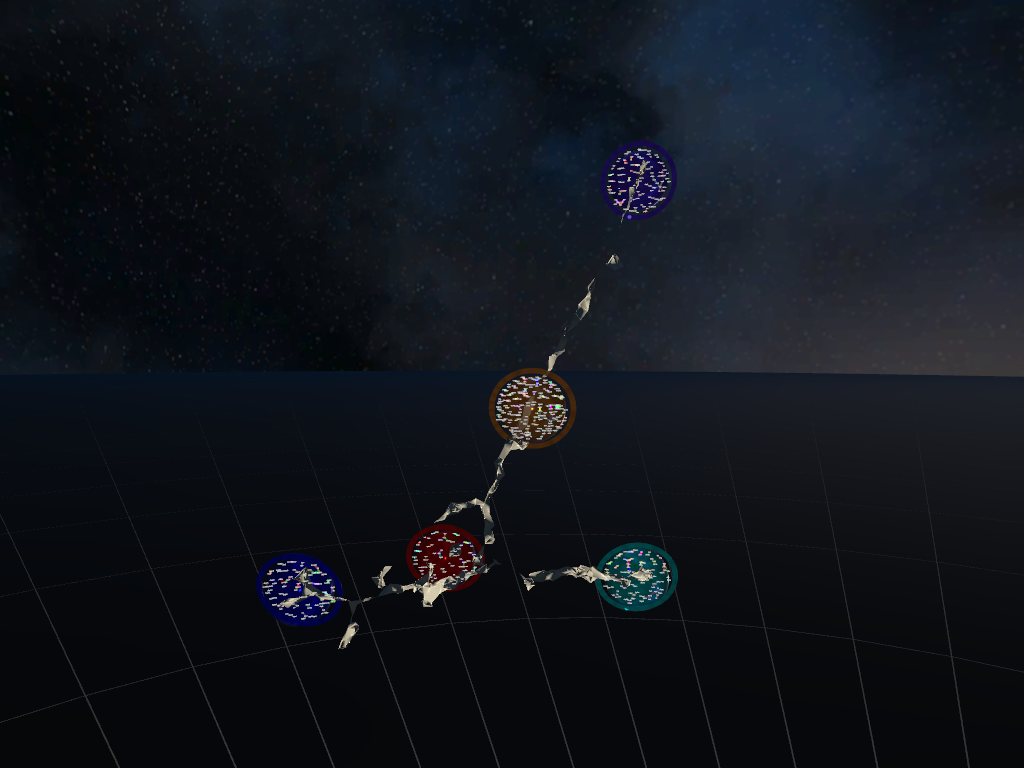
To create gene correlation networks, create a grouping with the selection tool, confirm it and press "create networks". The CellexalVR R package will generate the networks in the background. This will take several seconds. While the R script is running, the floor will show a pulse. When the networks are done they will appear next to the graph they were created from, on a skeleton of the graph. The skeleton can be moved around. The colored spheres attached to the new graph skeleton are the generated networks. There will be one network for each group your grouping included.
To get a better viewing of one of the networks, move the action controller inside it and press the trigger. The network will "pop out" and can now be moved and scaled just like heatmaps and graphs. The network consists of small spheres representing genes. The gene names are written next to the spheres. The lines between the genes means that two genes are correlated. The lines are given colors depending on the gene regulatory network part in the settings. The default option is that the lines are colored based on the correlation. The colors that are then given to the lines are also defined in the settings. By default the lines are colored from yellow to red if there is a positive correlation, red meaning higher correlation, and from green to blue if there is a negative correlation, blue meaning a more negative (stronger) correlation. The other option is to give the lines random colors that mean nothing, they only make it easier to look at when many lines are crossing eachother. Moving the action controller inside a sphere will highlight it and its connections. Pressing the trigger on the action controller when it is highlighting a gene will color all graphs according to the chosen gene's expression.
By default the networks are laid out on a flat surface. There are buttons on the rings around each network that can be pressed using the laser tool to switch to a 3D layout instead, you may switch between the 2D and 3D layouts at any time by pressing the "Switch to 2D" and "Switch to 3D" buttons. Since the algorithm creating the layouts is random by design, you can recalculate any of the two layouts by pressing the "Recalculate 2D" or "Recalculate 3D" buttons to get a new layout.
On the ring around the networks there are also two buttons that allow you to save the network as an image or a text file. The image version usually turns out ok if there aren't too many genes in the network, and if there is not a lot of overlapping, else the gene names become very hard to read. The text file's format is covered under the file format section. Both the image and the text file is saved in a folder located at Output/<username>/<dataset>/Networks.